CVA Evolution

Reference Images

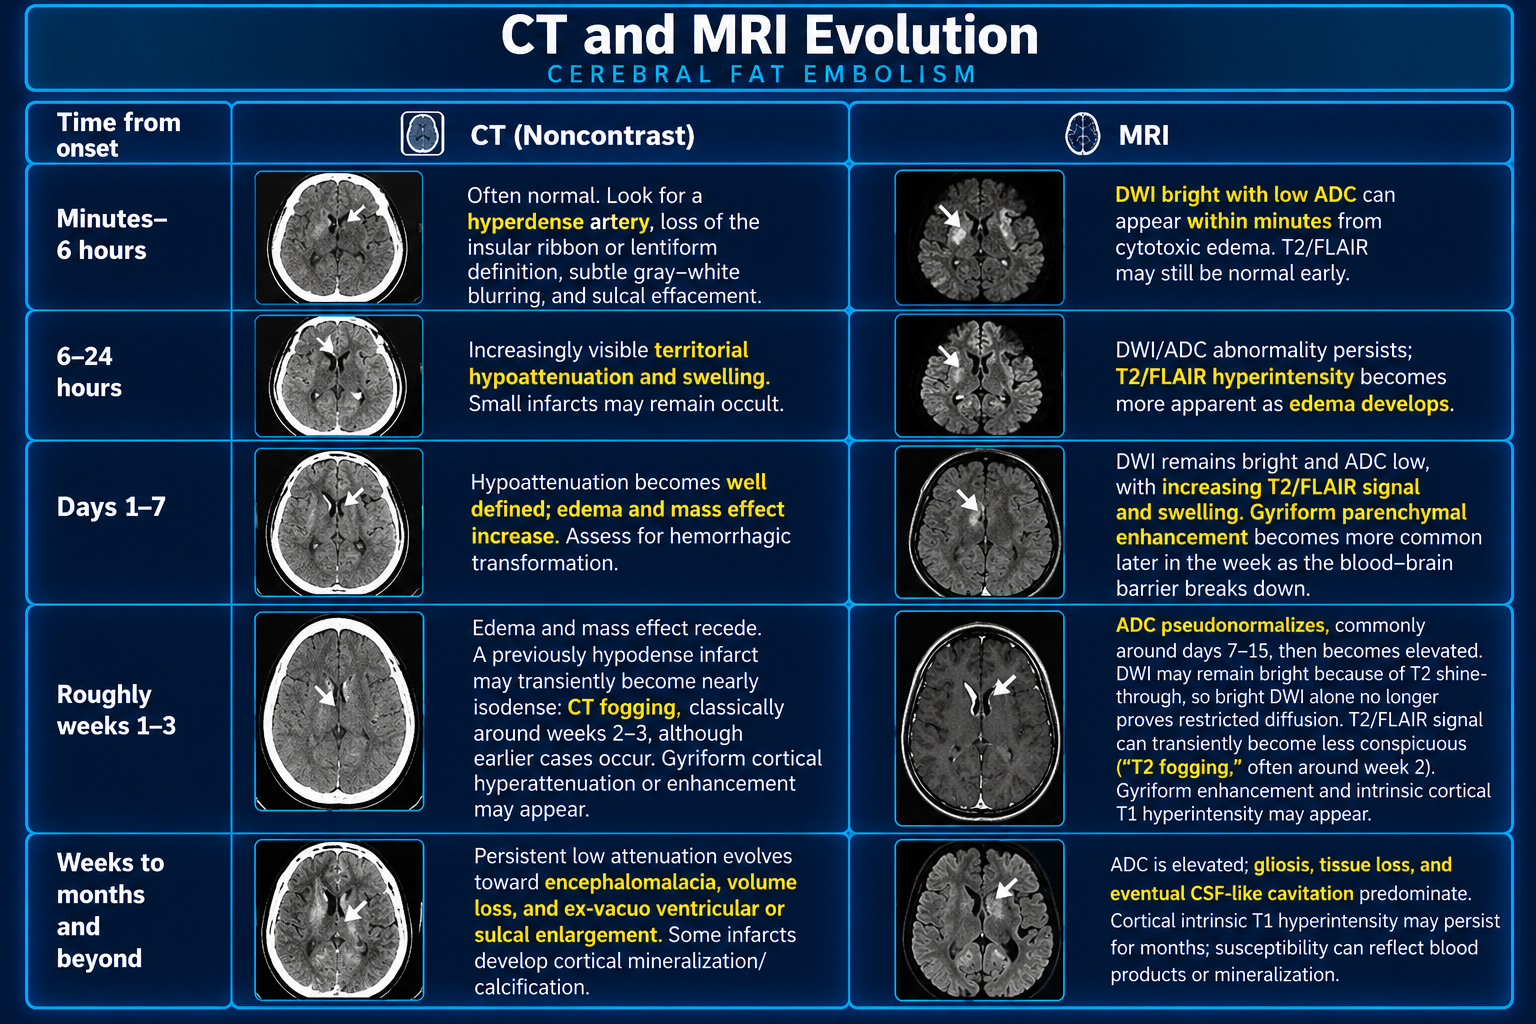
CT and MRI evolution timeline for cerebral infarction from the first minutes through chronic stages
CT and MRI Evolution TimelineClick to enlarge
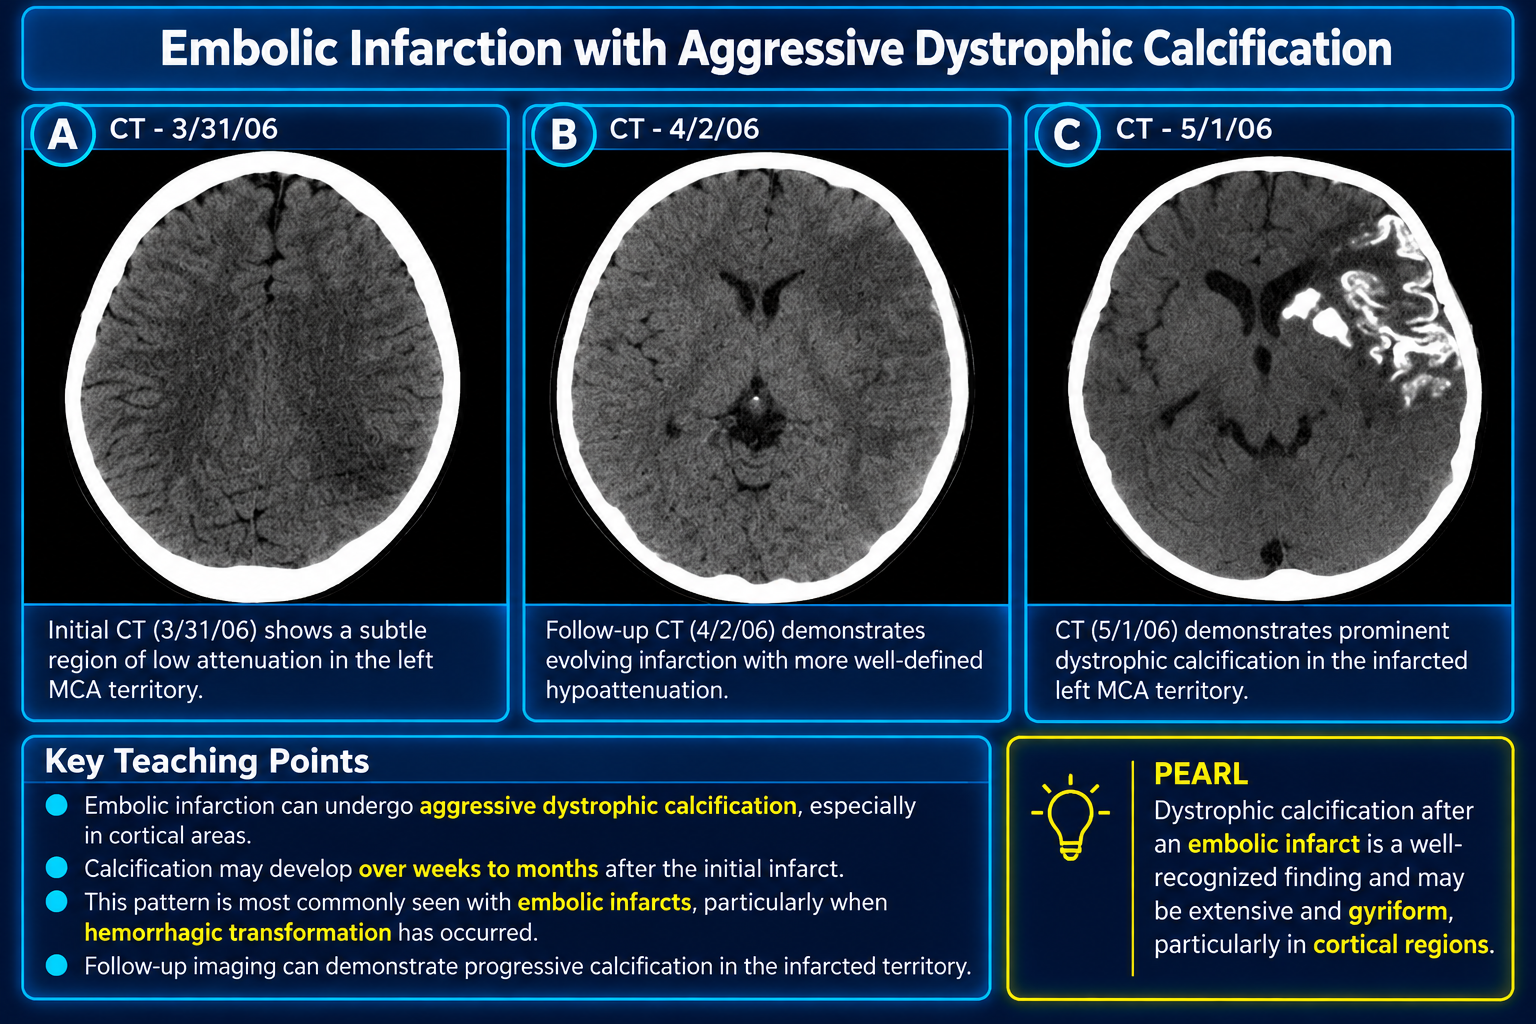
Serial CT images showing an evolving left MCA infarct followed by extensive gyriform dystrophic calcification
Dystrophic Calcification After Embolic InfarctionClick to enlarge
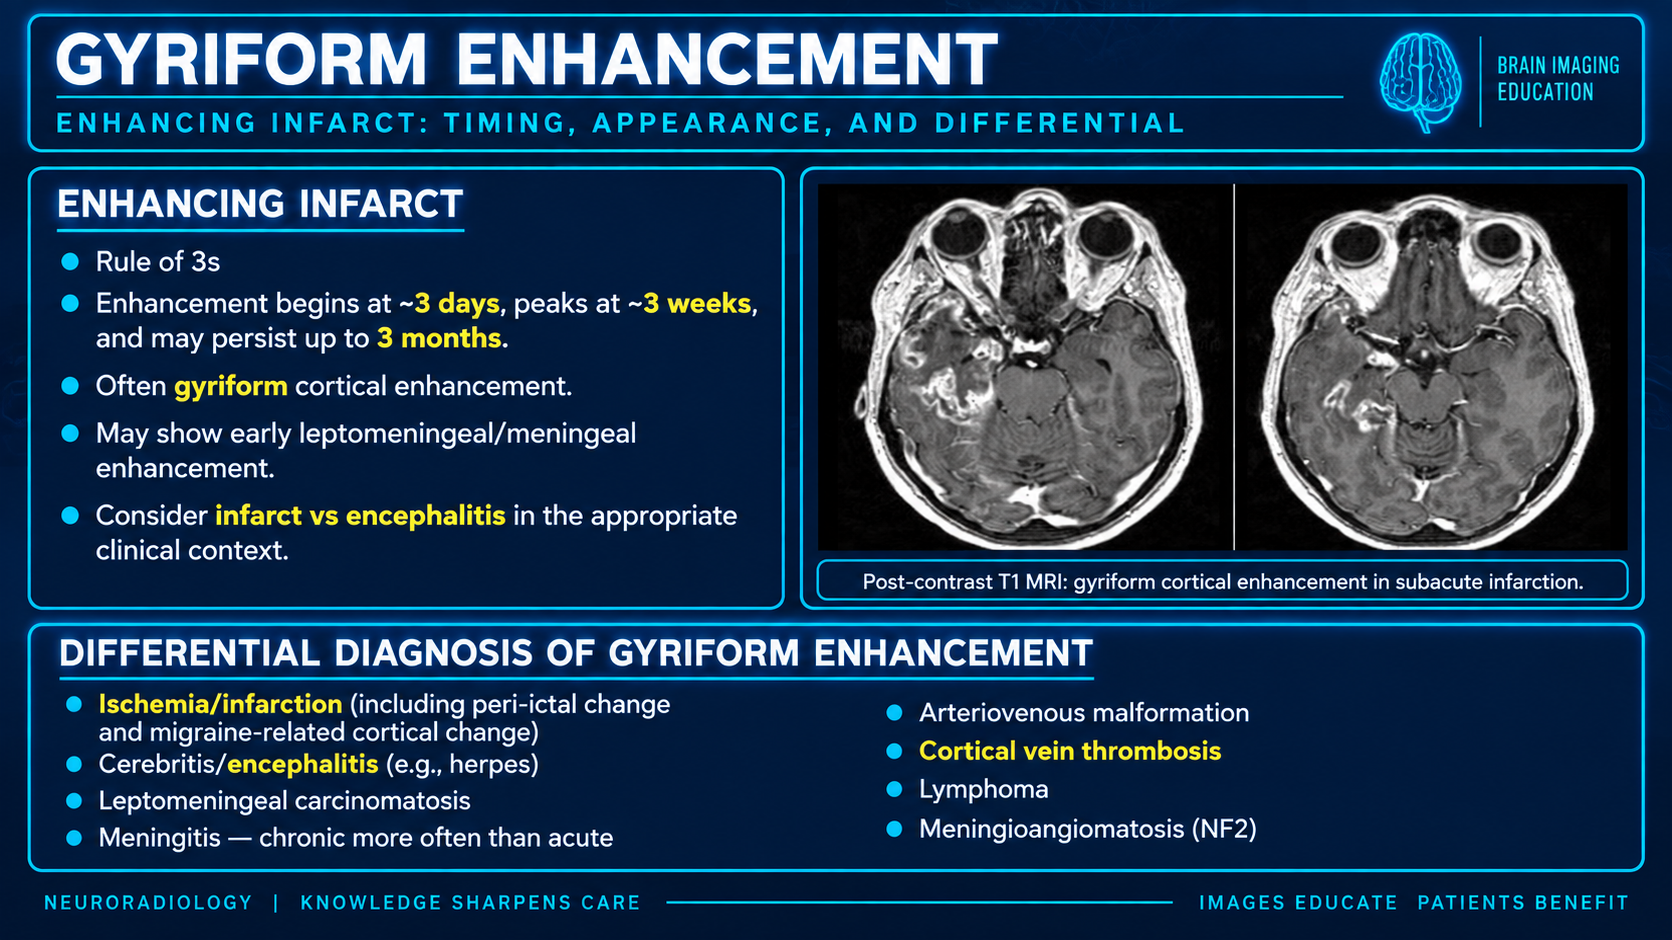
Postcontrast T1 MRI demonstrating gyriform cortical enhancement in subacute infarction with a differential diagnosis summary
Gyriform Enhancement in Subacute InfarctionClick to enlarge

The CT and MRI appearance of an ischemic infarct changes predictably over time, but the intervals are approximate and vary with infarct size, reperfusion, and hemorrhagic transformation. In the subacute period, distinguish three separate forms of pseudonormalization: ADC returning toward normal despite established infarction, transient disappearance of CT hypoattenuation (CT fogging), and temporary reduction of T2/FLAIR conspicuity (T2 fogging).

CT and MRI Timeline

Time from onsetNoncontrast CTMRI
Minutes-6 hoursOften normal. Look for a hyperdense artery, loss of the insular ribbon or lentiform definition, subtle gray-white blurring, and sulcal effacement.DWI can become bright with low ADC within minutes because of cytotoxic edema. T2/FLAIR may remain normal early.
6-24 hoursTerritorial hypoattenuation and swelling become increasingly visible. Small infarcts may remain occult.DWI/ADC abnormality persists; T2/FLAIR hyperintensity becomes more apparent as edema develops.
Days 1-7Hypoattenuation becomes well defined; edema and mass effect increase. Assess for hemorrhagic transformation.DWI remains bright and ADC low, with increasing T2/FLAIR signal and swelling. Gyriform parenchymal enhancement becomes more common later in the week as the blood-brain barrier breaks down.
Roughly weeks 1-3Edema and mass effect recede. A previously hypodense infarct may become nearly isodense during CT fogging, classically around weeks 2-3, although earlier cases occur. Gyriform cortical hyperattenuation or enhancement may appear.ADC commonly pseudonormalizes around days 7-15 and then becomes elevated. DWI may remain bright because of T2 shine-through, so bright DWI alone no longer proves restricted diffusion. T2/FLAIR signal can transiently become less conspicuous during T2 fogging, often around week 2. Gyriform enhancement and intrinsic cortical T1 hyperintensity may appear.
Weeks to months and beyondPersistent low attenuation evolves toward encephalomalacia, volume loss, and ex-vacuo ventricular or sulcal enlargement. Some infarcts develop cortical mineralization or calcification.ADC is elevated; gliosis, tissue loss, and eventual CSF-like cavitation predominate. Cortical intrinsic T1 hyperintensity may persist for months; susceptibility can reflect blood products or mineralization.

Laminar Necrosis and Calcification

Cortical laminar necrosis is selective injury to cortical layers. Its familiar imaging clue is a gyriform ribbon of intrinsic T1 hyperintensity on precontrast images, typically evident by approximately 2 weeks and most prominent around 1-3 months; it may persist longer.

It can coexist with gyriform contrast enhancement, but intrinsic T1 signal and enhancement should be assessed separately. A T1-bright ribbon does not, by itself, establish hemorrhage or calcification. Stroke Manual · Radiopaedia

Dystrophic calcification or mineralization is a later potential sequela in damaged cortex. It appears as gyriform hyperattenuation on noncontrast CT and may produce susceptibility on GRE/SWI. CT helps distinguish mineralization from blood products.

Not every late gyriform cortical hyperdensity is calcification, and the label laminar necrosis should not be applied indiscriminately to every cortical change after a full-thickness territorial infarct.

The original teaching file remains available as a read-only reference: CVA Evolution PDF.
Practical Reading Pitfalls

Normal-looking ADC does not exclude a subacute infarct. Check DWI against the ADC map and use FLAIR, T1, enhancement, and prior imaging to assess age. Stroke Manual

Reduced CT conspicuity does not necessarily indicate resolving tissue injury. Fogging is temporary; later imaging typically reveals hypoattenuation and volume loss again. Review article

Gyriform T1 brightness, contrast enhancement, hemorrhage, and calcification are distinct observations. Describe the sequence or modality demonstrating each rather than treating them as interchangeable.

  • ADC pseudonormalization: diffusion metric returning toward normal despite established infarction.
  • CT fogging: temporary loss of CT hypoattenuation.
  • T2 fogging: transient reduction in T2/FLAIR conspicuity.

Their timing overlaps, but they are not the same finding.

Medical source material supplied by the user; original images and PDF preserved.

Secondary Links