Perivascular Spaces in Old Age: Assessment, Distribution, and Correlation with White Matter Hyperintensities
Key Images
Look For First
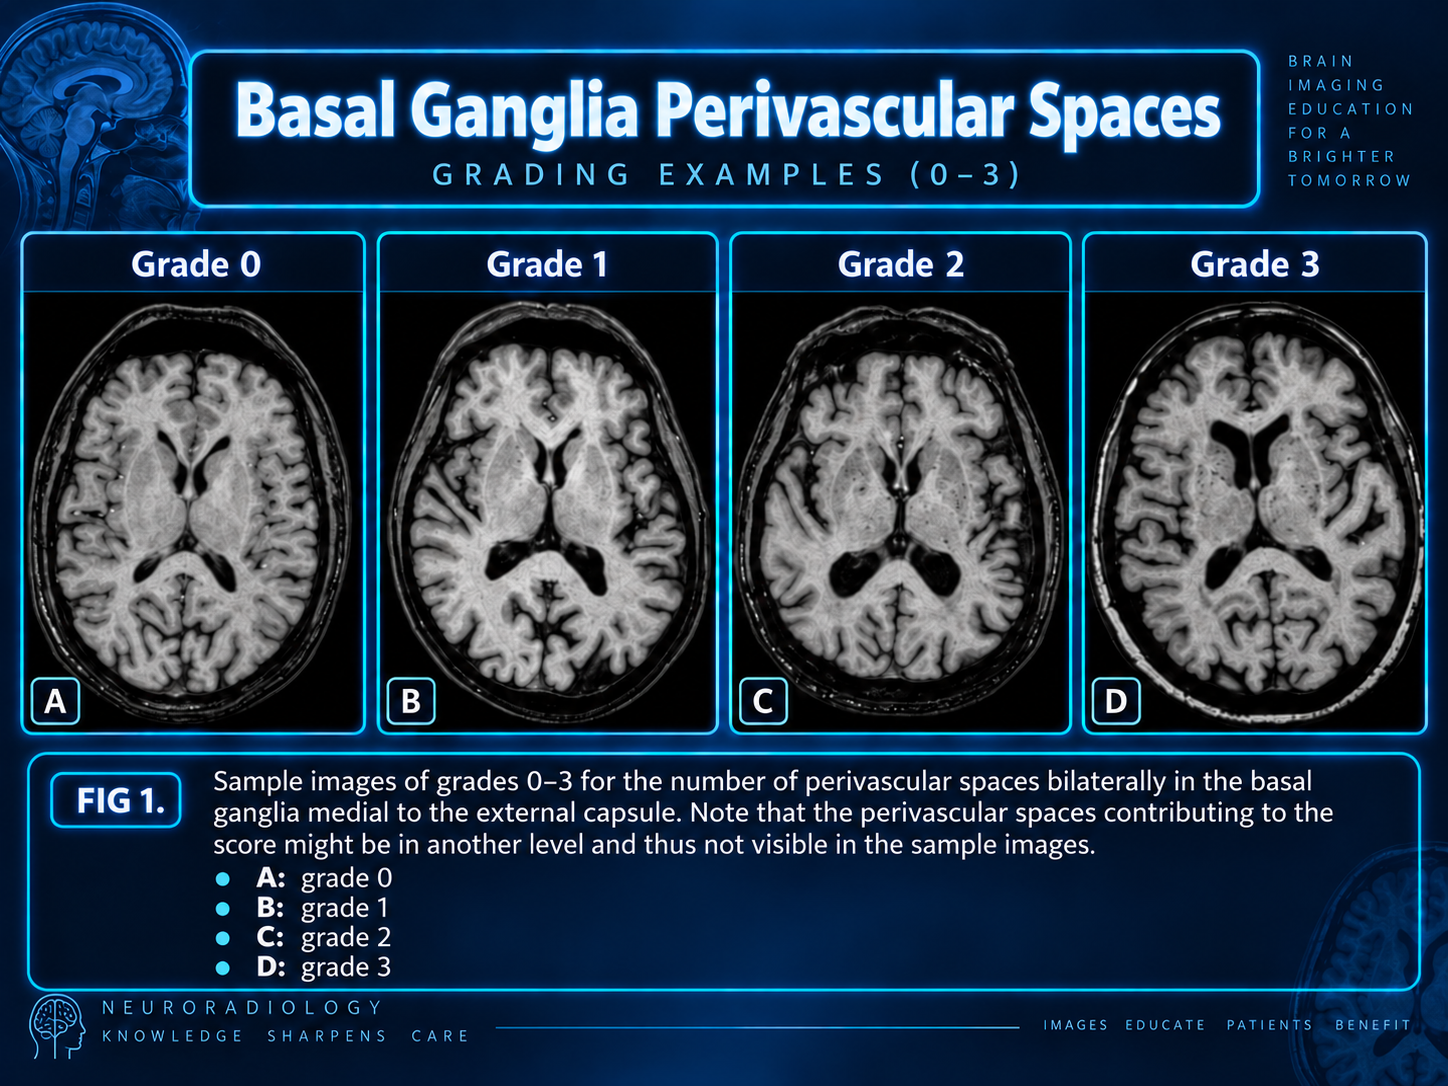
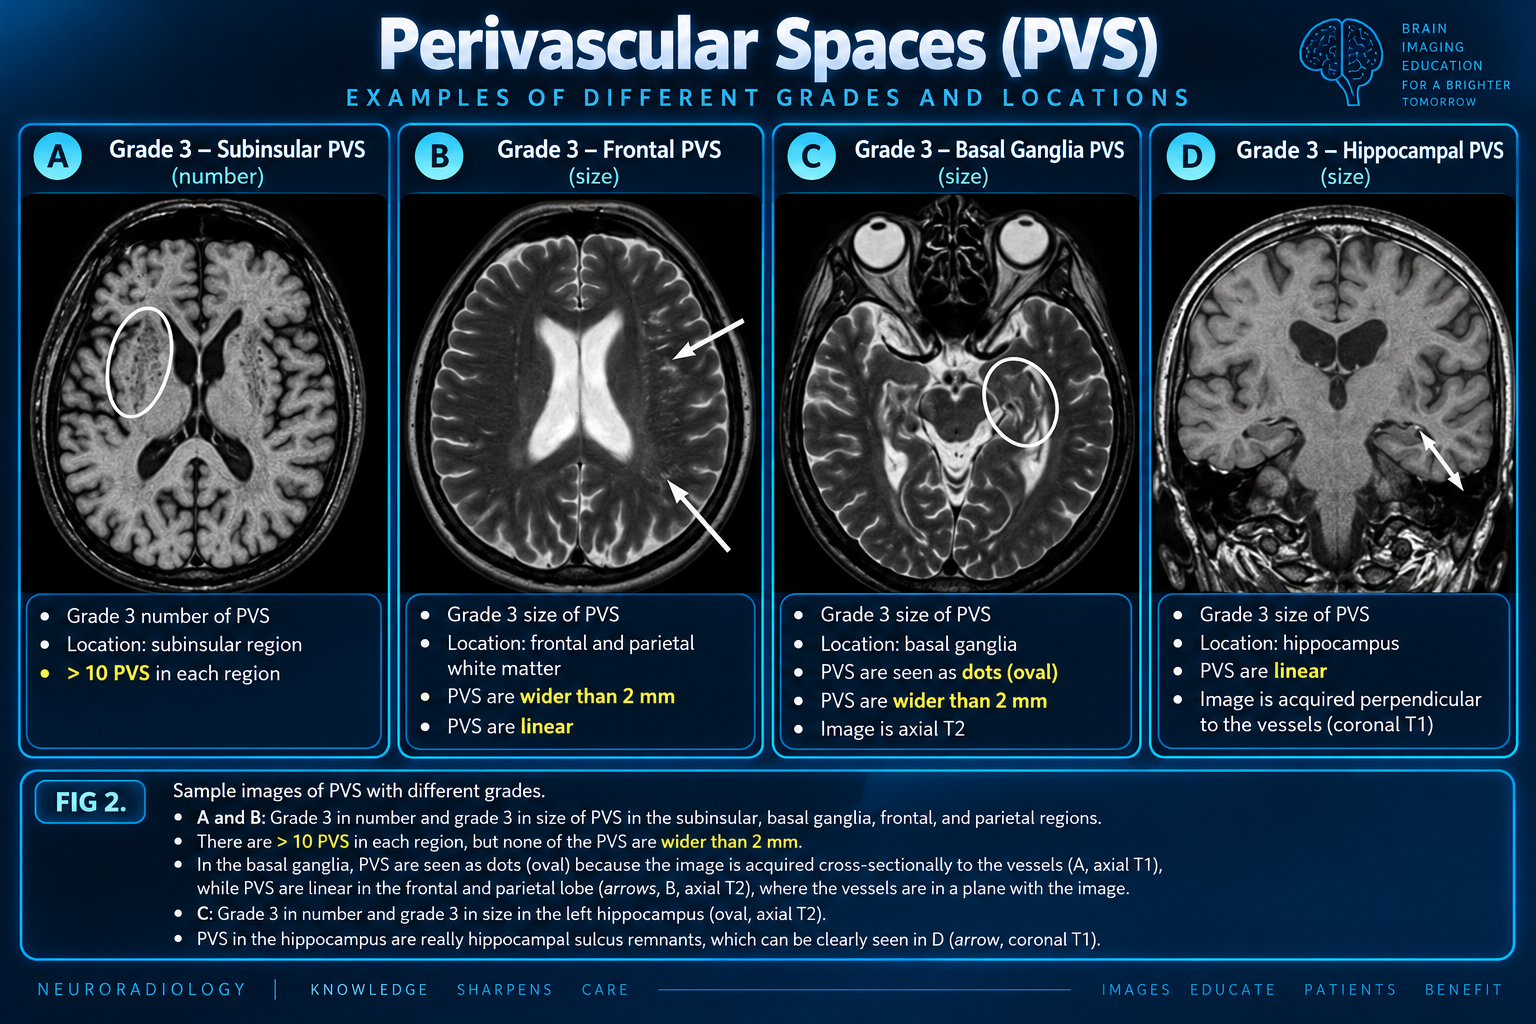
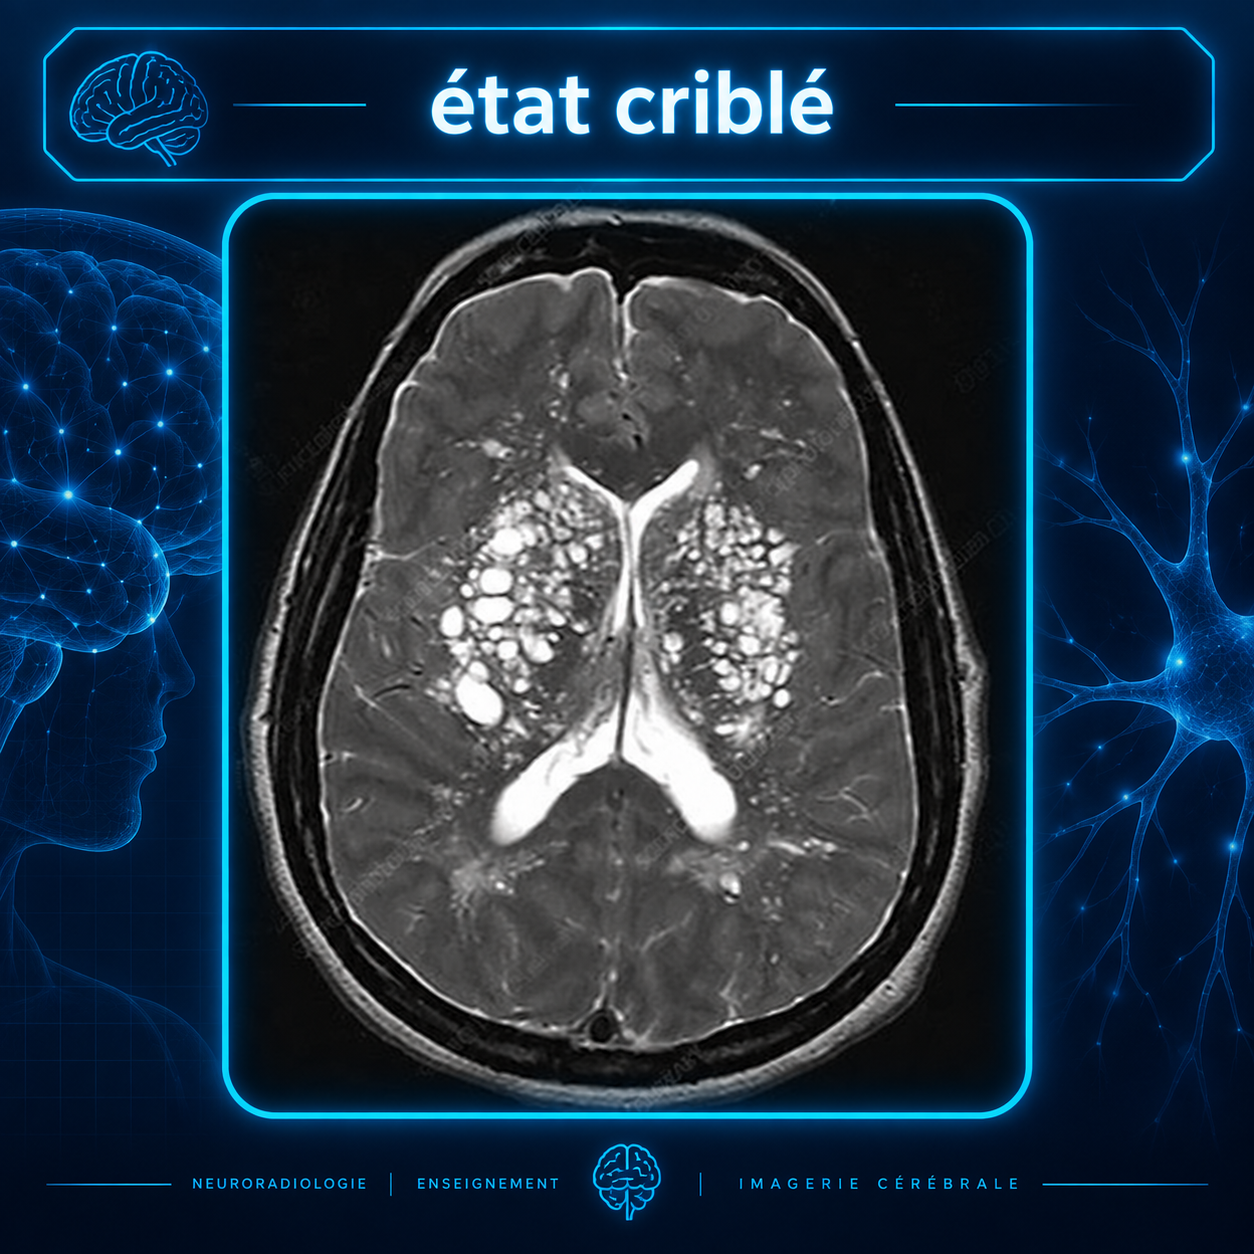
- Linear or rounded hypointense spaces following vascular distributions on T1 and T2 sequences, particularly in basal ganglia appearing as dots/ovals on axial imaging
- Symmetric distribution of perivascular spaces across brain regions, with highest concentration in frontal and basal ganglia regions (~45-60% of subjects)
- Key distinction: use T1 3D volume images for basal ganglia and subinsular regions to separate perivascular spaces from lacunes and choroidal cysts; use T2 and FLAIR for lobar assessment
Key Image Findings
- Perivascular spaces appear as hypointense linear or rounded structures on T1-weighted and T2-weighted sequences, representing spaces between arterial adventitia and glial limiting membrane involved in brain lymphatic drainage.
- On axial T1 3D MPRAGE imaging, perivascular spaces in basal ganglia appear as small dots or ovals when imaged perpendicular to vessels, while on axial T2 in frontal/parietal lobes they appear linear when vessels are parallel to image plane.
- Maximum diameter measurement of perivascular spaces scored as: 0 (none), 1 (1-2 mm), 2 (3-4 mm), 3 (≥4 mm), with large spaces ≥4 mm present in only 1.1% of elderly population.
- Number of perivascular spaces scored per region as: 0 (none), 1 (1-5 spaces), 2 (6-10 spaces), 3 (≥10 spaces); global score ranges 4-32 for number, 3-22 for size, 7-54 combined.
- Regional distribution predominantly in basal ganglia (45% with 6-10 spaces), frontal lobe (60% with ≥10 spaces), parieto-occipital lobe (60% with ≥10 spaces), and minimal in cerebellum (85% with none).
- FLAIR sequence distinguishes perivascular spaces from lacunes; lacunes show high FLAIR signal or irregular shape, while perivascular spaces maintain rounded/elongated shape with low FLAIR signal.
- Perivascular space score in basal ganglia and subinsular regions correlate with total white matter hyperintensity load and lobar/deep white matter hyperintensity burden (partial correlation coefficient 0.223, p<0.01).
- Size of perivascular spaces shows minimal age-related change (correlation coefficient 0.057, p<0.01), while number increases significantly with age (correlation coefficient 0.162, p<0.01), suggesting quantity is clinically more relevant than diameter.
Differential Diagnosis
- Lacunes vs perivascular spaces: lacunes show high FLAIR signal intensity surrounding the lesion or demonstrate irregular shape, whereas perivascular spaces maintain rounded/elongated morphology with suppressed FLAIR signal
- Choroidal fissure cysts vs perivascular spaces in basal ganglia/subinsular region: use 3D T1 volume image tracking through sequential sections to confirm vascular distribution pattern of perivascular spaces
- Enlarged perivascular spaces in basal ganglia vs basal ganglia lacunar infarcts: perivascular spaces are smaller (<3-4 mm typical), follow vascular distributions, and show normal surrounding parenchyma on FLAIR
- Hippocampal sulcus remnants vs hippocampal perivascular spaces: hippocampal perivascular spaces are actually remnants of hippocampal sulcus and appear as linear structures on coronal T1 imaging
- White matter hyperintensity burden vs perivascular spaces in basal ganglia: use T1 instead of T2 imaging to reduce disturbance from adjacent white matter hyperintensities that could obscure assessment
Discussion
Perivascular spaces are markers of cerebral small-vessel disease; number (not size) of perivascular spaces in basal ganglia correlates with white matter hyperintensity burden, supporting their role in vascular pathophysiology
New visual rating scale incorporates number, size, and anatomic location per STRIVE standards, improving standardization across research studies and providing better reliability (intra/interrater κ = 0.77)
Regional variation in perivascular space etiology: basal ganglia and subinsular regions show strong association with white matter hyperintensities (small-vessel disease), while frontal and parietal lobes do not, suggesting different pathophysiologic mechanisms by location
Perivascular space number increases significantly with advancing age (p<0.001) but size remains relatively stable, indicating age-related widening of existing spaces rather than new space formation
Hypertension and amyloid deposition are proposed etiologies for perivascular space widening, though the predominance of hyperintensive cases and regional distribution suggest vasculopathic changes as primary driver
Perivascular spaces show symmetric distribution across hemispheres and no significant sex differences in global burden, though earlier studies reported male predominance in basal ganglia requiring further investigation
Reporting Pearls
Report perivascular spaces by region, number grade (0-3: none/1-5/6-10/≥10), and size grade (0-3: none/1-2mm/3-4mm/≥4mm), noting that prominent basal ganglia perivascular spaces correlate with white matter hyperintensity burden and suggest cerebral small-vessel disease; use the phrase "prominent perivascular spaces in basal ganglia and subinsular regions" when combined score is high to highlight the small-vessel disease implications.
Pitfalls
- Confusing perivascular spaces with lacunes on T2/FLAIR imaging; always check FLAIR signal (suppressed for perivascular spaces, bright rim for lacunes) and use 3D T1 volume tracking to confirm vascular distribution
- Using T2 instead of T1 3D imaging for basal ganglia assessment increases false positives due to white matter hyperintensity artifact mimicking perivascular spaces in this high-burden region
- Failing to adjust for regional differences in perivascular space pathophysiology; basal ganglia and subinsular spaces have clinical significance for small-vessel disease, while lobar spaces do not correlate with white matter burden
- Measuring obliquely imaged perivascular spaces along the longest diameter rather than smallest diameter leads to overestimation of size; always use smallest diameter measurement for consistent grading