Uremic encephalopathy
Key Images
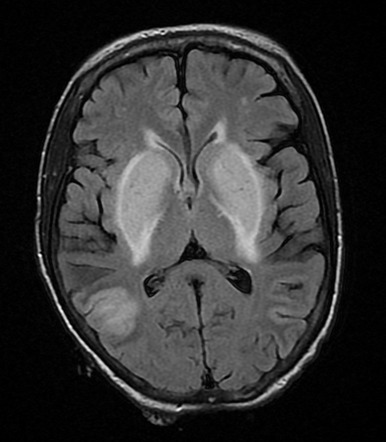
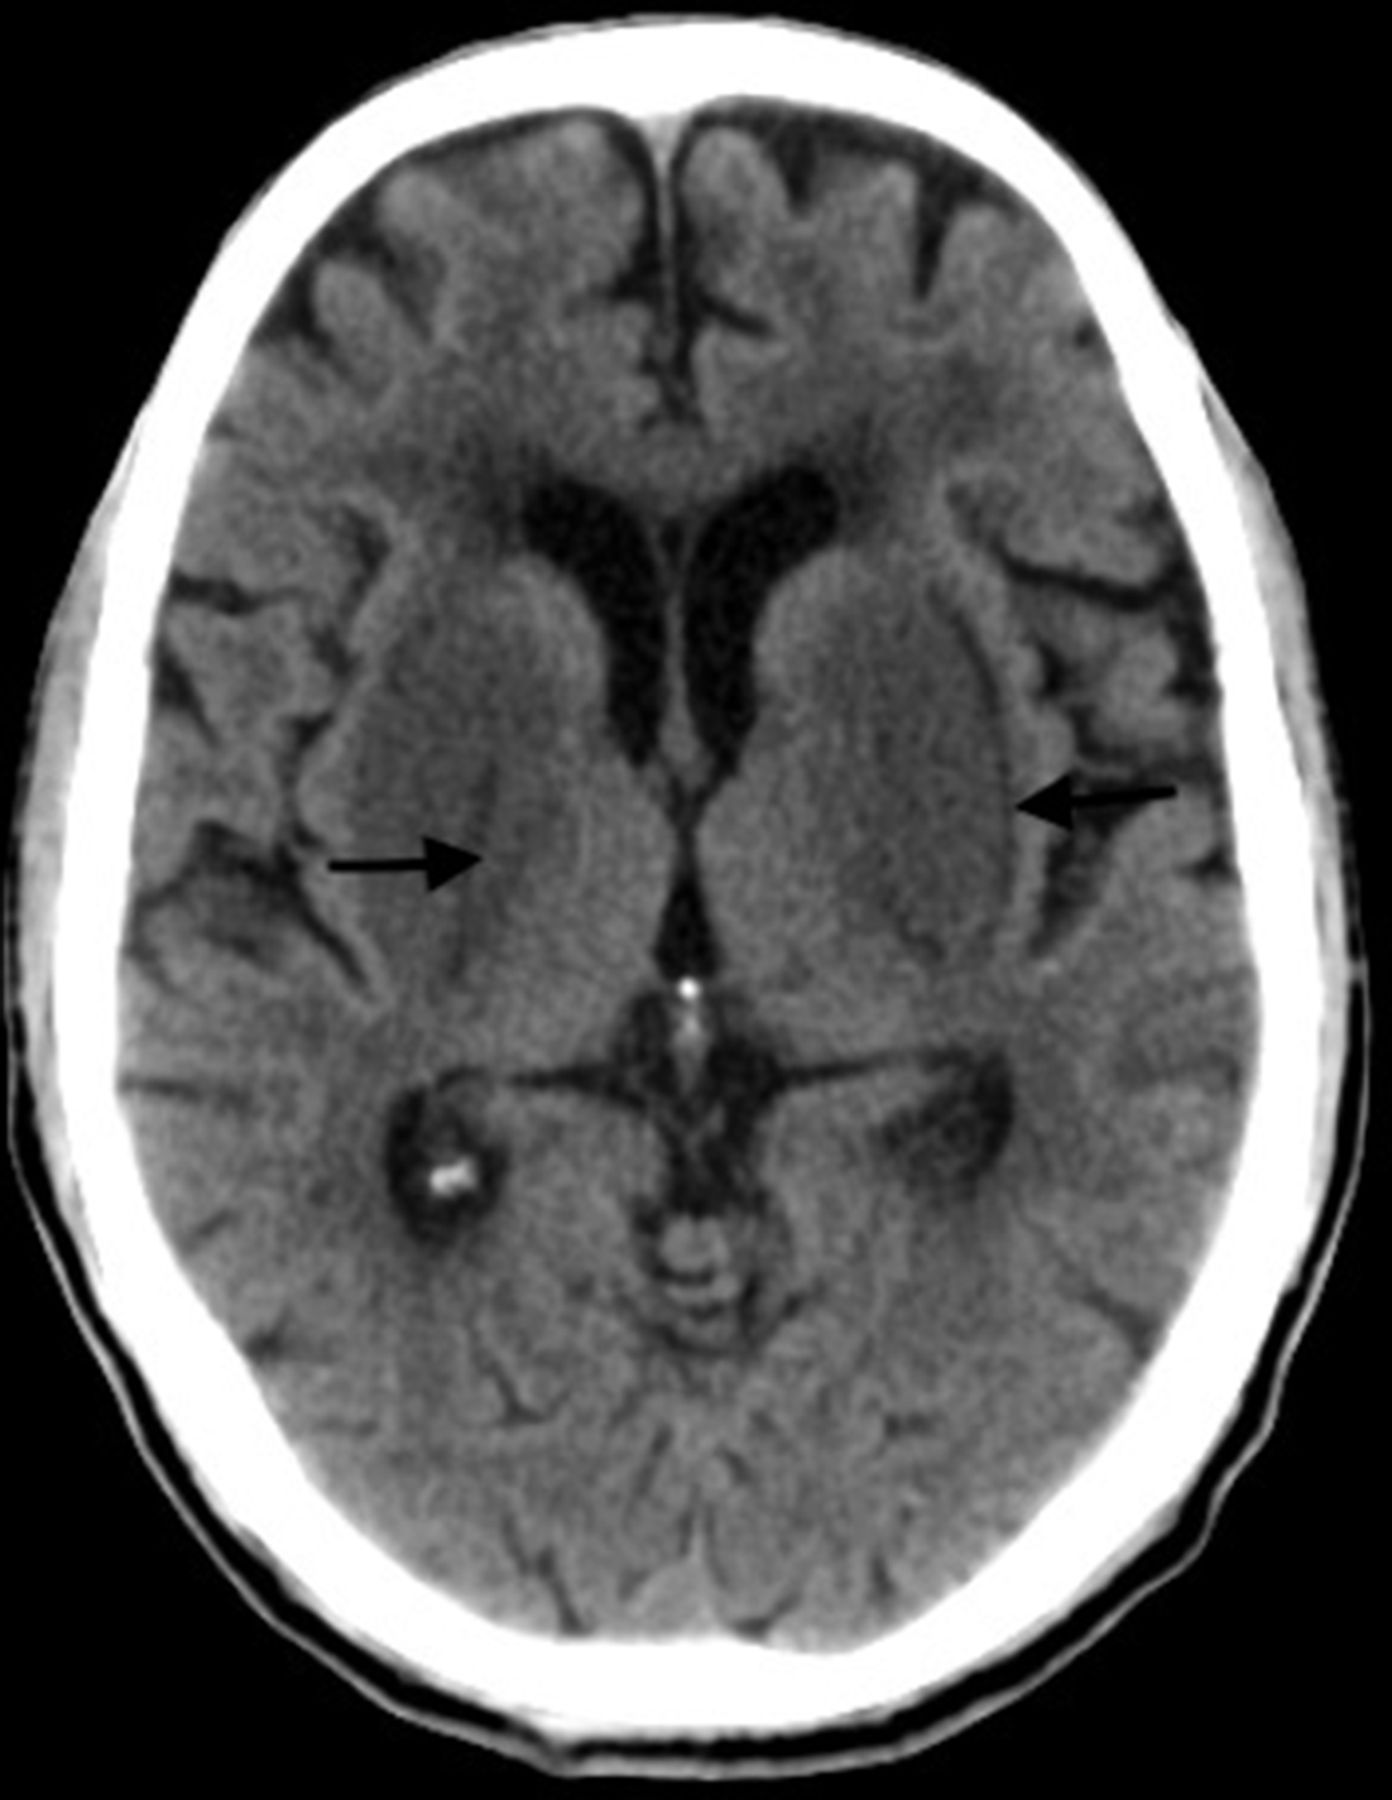
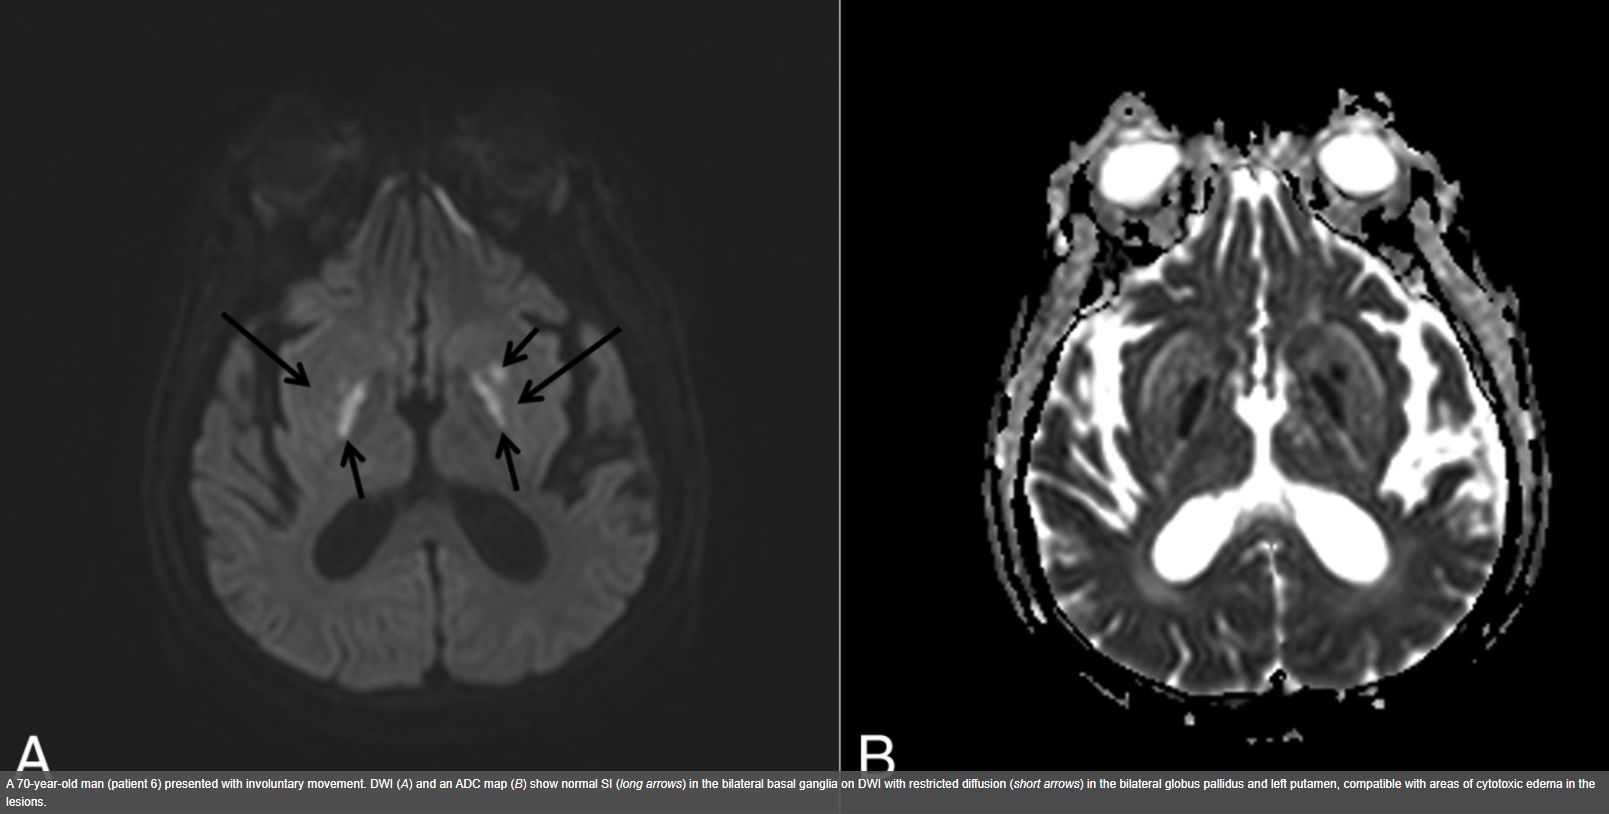
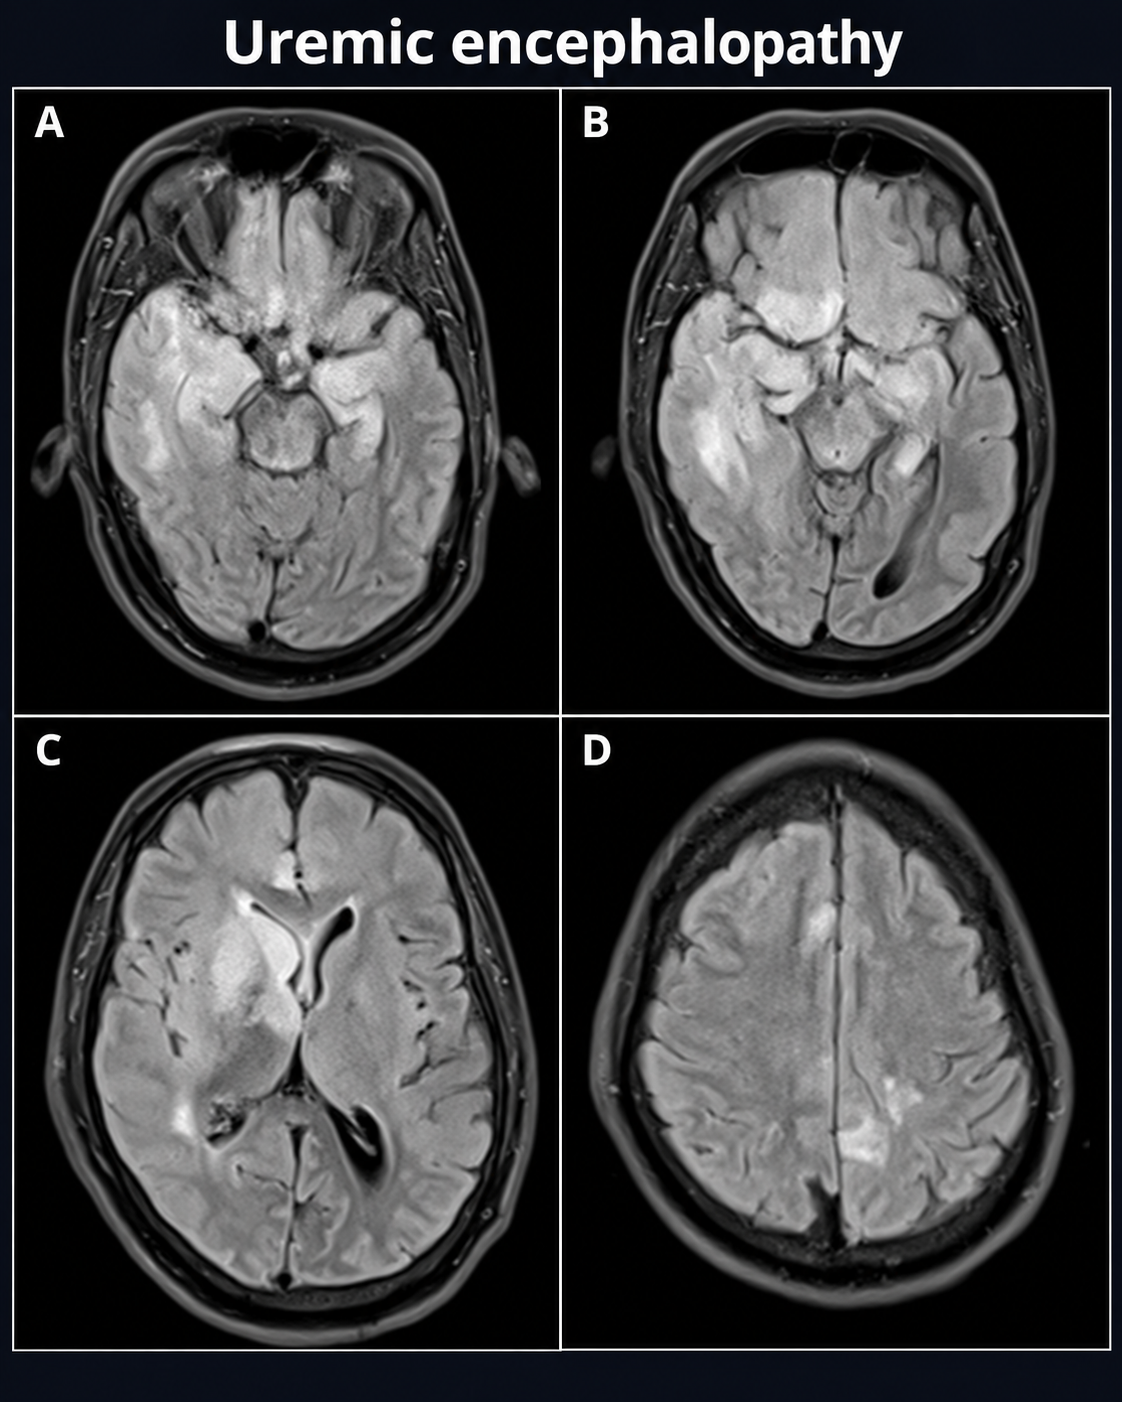
Look For First
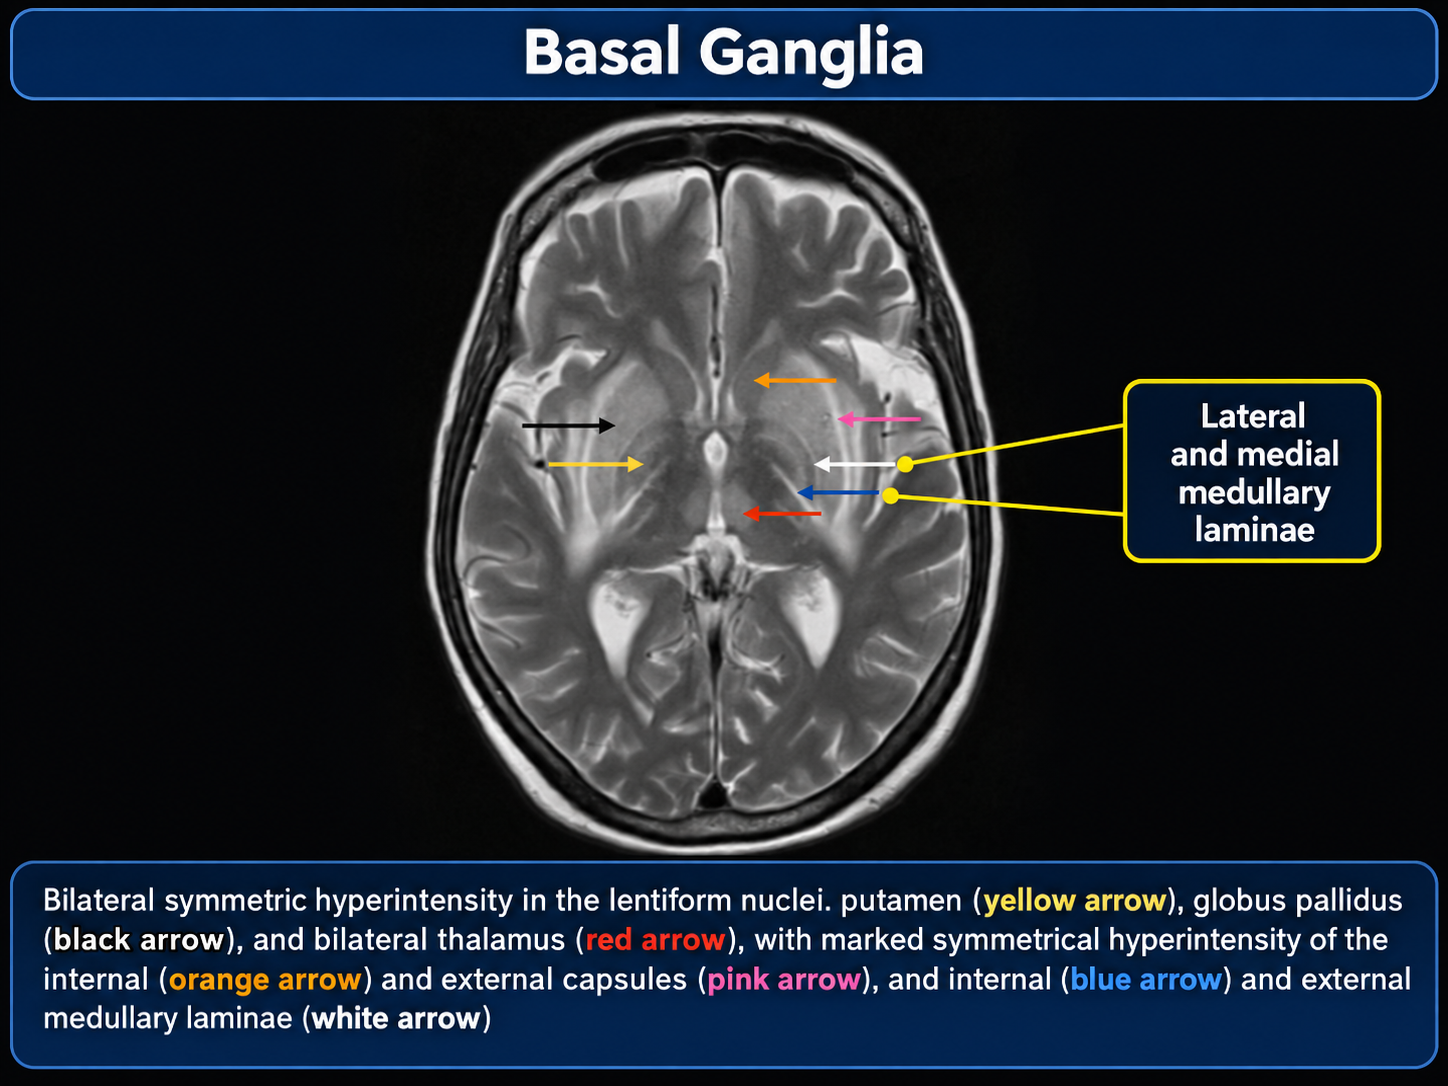
- Bilateral T2/FLAIR hyperintensities in the basal ganglia, thalamus, and midbrain on MRI
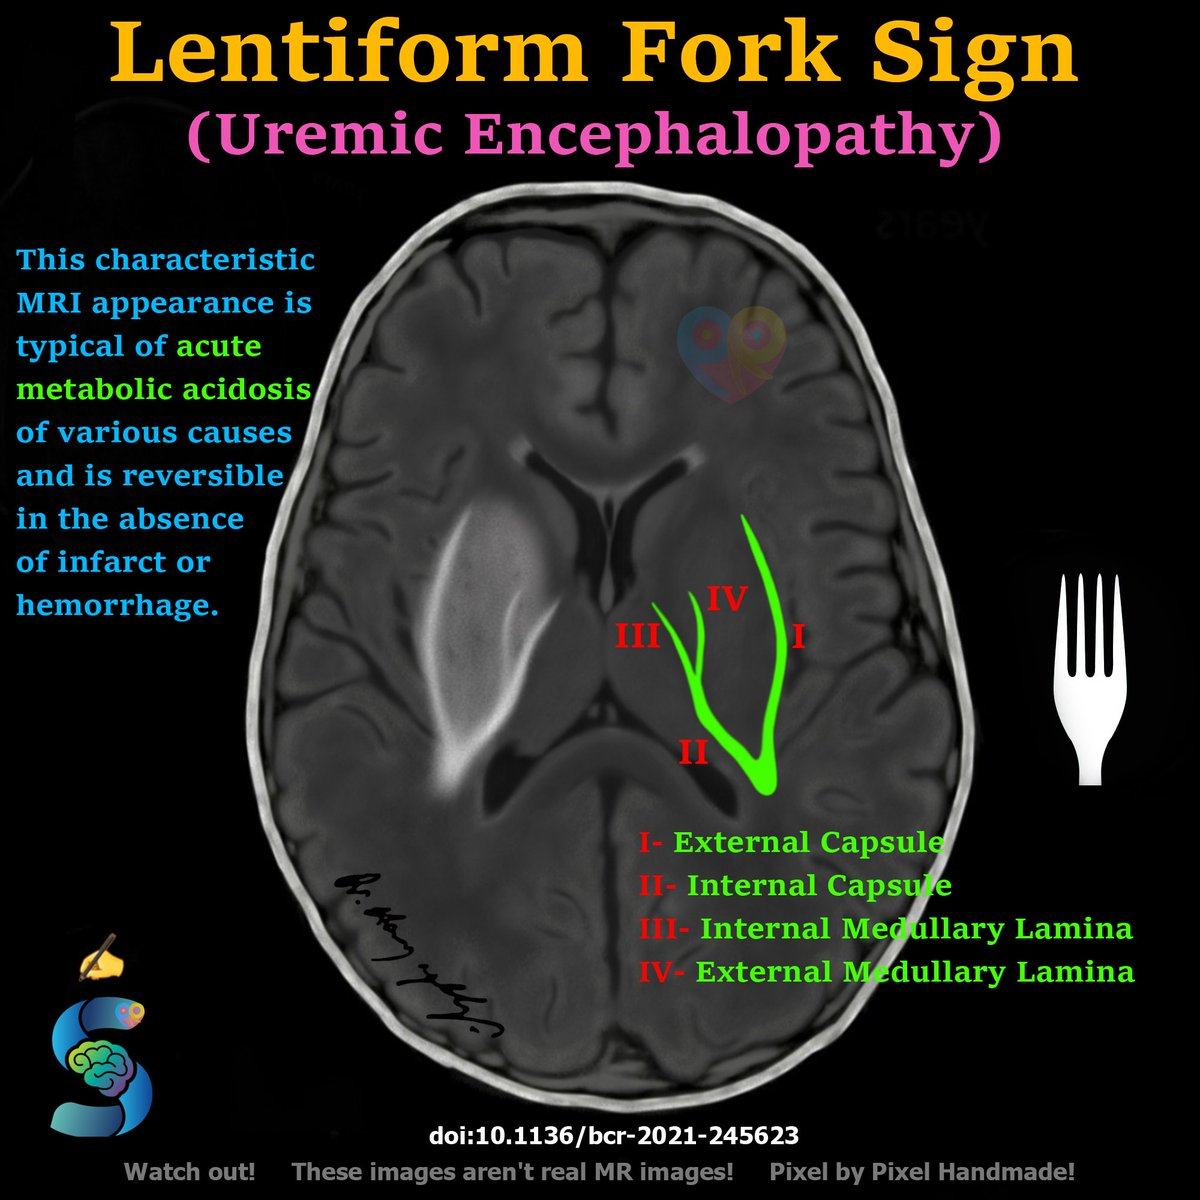
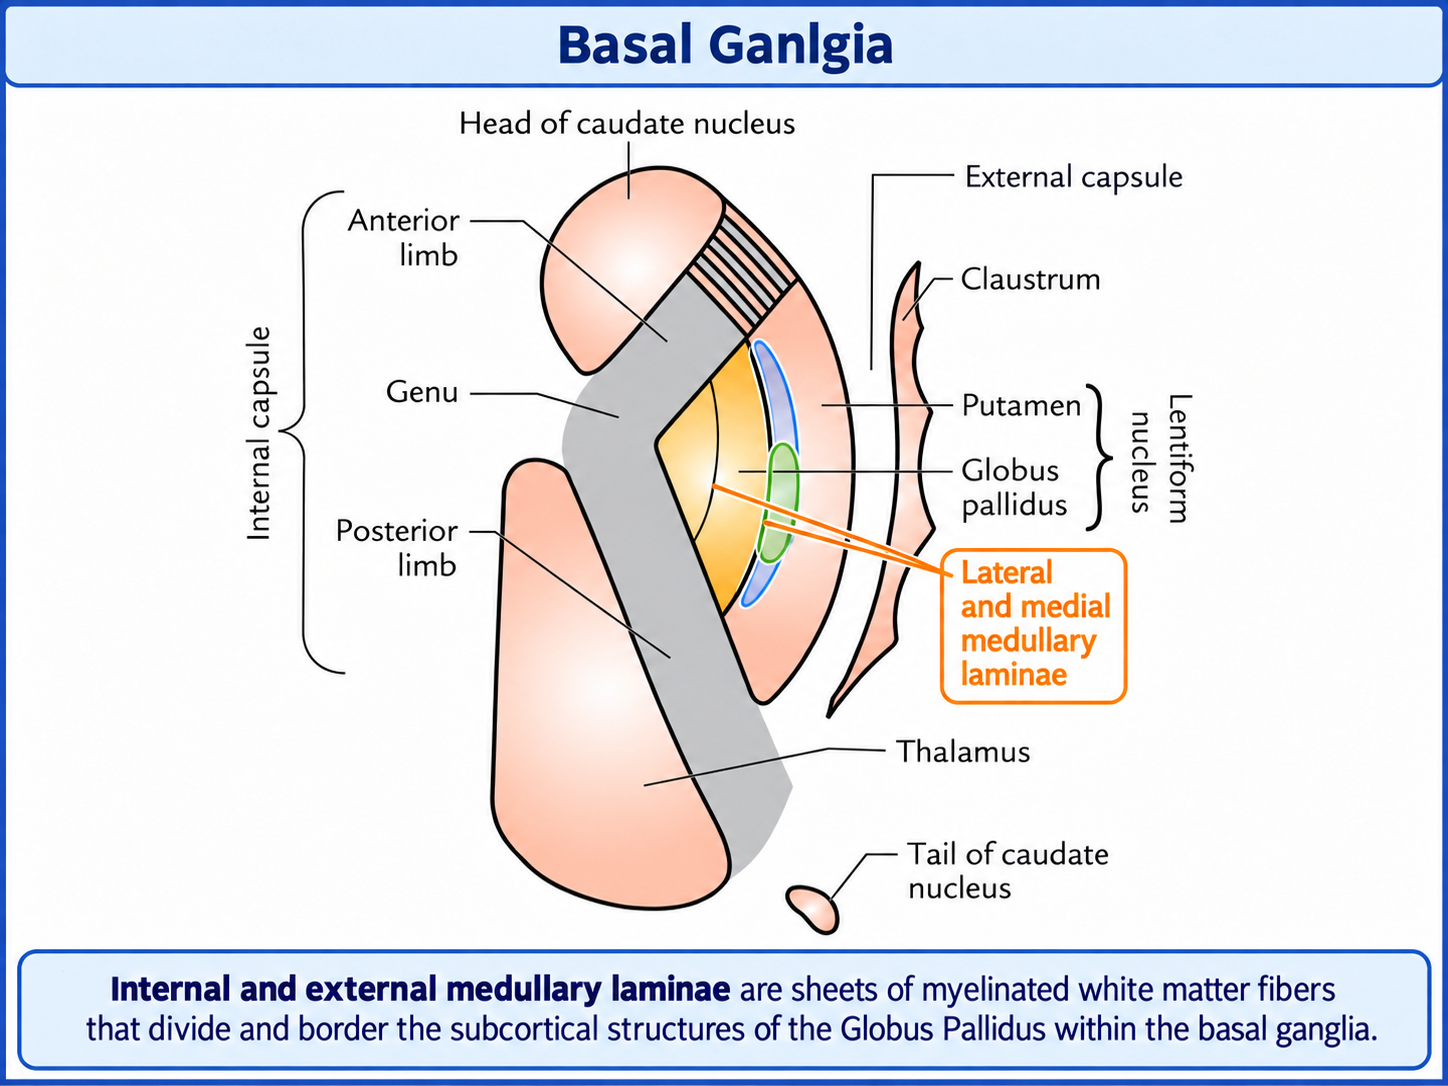
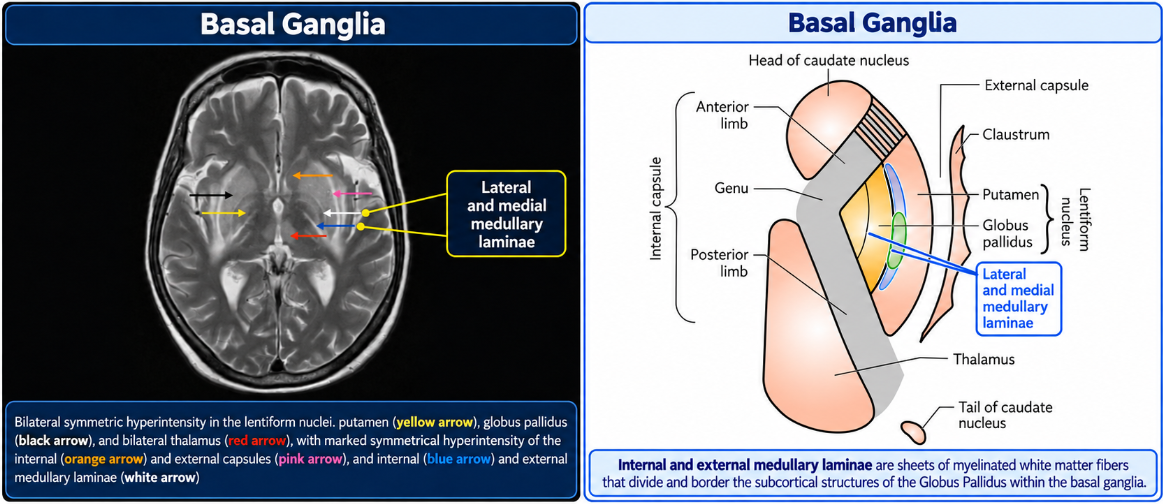
- Lentiform fork sign: hyperintense white matter surrounding the basal ganglia (internal/external capsules and medullary laminae) on T2/FLAIR
- Involvement of mesial temporal lobes with symmetric pattern of edema
Key Image Findings
- On MRI, uremic encephalopathy presents as bilateral T2/FLAIR hyperintensities involving the basal ganglia, thalamus, midbrain, and mesial temporal lobes reflecting cytotoxic edema in metabolically sensitive subcortical regions.
- The lentiform fork sign is a characteristic MRI feature where white matter surrounding the basal ganglia (internal capsule, external capsule, and medullary laminae) becomes hyperintense on T2/FLAIR sequences.
- Restricted diffusion may or may not be present to varying degrees but is NOT a characteristic feature of uremic encephalopathy, distinguishing it from acute infarction.
- CT imaging shows confluent bilateral hypodensity involving the basal ganglia, thalamus, and midbrain with obliteration of anatomical boundaries between deep subcortical grey matter structures.
- Enhancement is not a typical feature of uncomplicated uremic encephalopathy, which helps distinguish it from inflammatory or infectious etiologies.
- The edema selectively involves subcortical grey matter, white matter tracts, midbrain, and mesial temporal lobes due to their exquisite sensitivity to metabolic alterations and vascular supply via arterial perforators.
- Imaging findings reflect cytotoxic edema localized to these metabolically vulnerable areas rather than vasogenic edema.
- In chronic cases, cerebral atrophy and gliosis may be seen on follow-up imaging.
Differential Diagnosis
- Hepatic encephalopathy: also causes bilateral basal ganglia T2 hyperintensities but often shows additional involvement of the globus pallidus and may have manganese deposition; hepatic encephalopathy typically shows more pronounced vascular permeability changes.
- Acute liver failure: presents with similar metabolic encephalopathy pattern but clinical context of hepatic dysfunction and hyperammonemia is distinctive.
- Hypoglycemia: causes diffuse cerebral edema but typically with more cortical involvement; resolves rapidly with glucose correction.
- Hyponatremia: creates osmotic edema affecting white matter more diffusely; mesial temporal lobe involvement is less typical.
- Drug toxicity and poisoning: may cause similar deep grey matter involvement but clinical history and specific toxin-related patterns help distinguish.
- Dialysis disequilibrium syndrome: occurs acutely during or after dialysis sessions with reversible edema; timing and clinical context differentiate from primary uremic encephalopathy.
Discussion
Uremic encephalopathy results from toxic metabolic alterations including changes in biogenic amines (norepinephrine, epinephrine, histamine, serotonin), disturbances in water and electrolyte homeostasis, and increased cerebral vascular permeability.
The selective vulnerability of subcortical grey matter, white matter, midbrain, and mesial temporal lobes relates to their blood supply via arterial perforators and their inherent sensitivity to metabolic derangements.
Seizures occur in up to one-third of uremic patients and can be generalized, focal, or present as epilepsia partialis continua; careful clinical evaluation is essential to exclude other causes such as malignant hypertension, infection, or cerebral infarction.
The predominant pattern of symmetric deep grey matter and subcortical white matter involvement with sparing of cortex is a key imaging clue that should prompt consideration of toxic-metabolic etiologies.
Dialysis is the primary treatment, and imaging changes may improve with appropriate renal replacement therapy, making serial imaging useful for assessing response to treatment.
Anemia, hyperparathyroidism, and brain calcium concentrations have been implicated in pathogenesis, suggesting multiple metabolic factors contribute to the encephalopathy.
Reporting Pearls
Describe uremic encephalopathy as bilateral symmetric T2/FLAIR hyperintensities involving the subcortical grey nuclei (basal ganglia and thalamus), midbrain, and mesial temporal lobes with characteristic lentiform fork sign (white matter surrounding basal ganglia), consistent with cytotoxic edema in a metabolically sensitive distribution; note absence of restricted diffusion and enhancement to exclude acute infarction and inflammation.
Pitfalls
- Mistaking the restricted diffusion, which may be present to varying degrees, as a diagnostic hallmark—restricted diffusion is NOT characteristic of uremic encephalopathy and may mislead toward acute infarction.
- Overlooking the lentiform fork sign (hyperintense white matter capsules around basal ganglia), which is a characteristic and distinctive feature that should be specifically commented on.
- Confusing uremic encephalopathy with acute hepatic encephalopathy based on similar basal ganglia involvement; clinical context and the pattern of white matter involvement (lentiform fork sign) are key distinguishers.
- Missing the requirement to evaluate for alternative causes of seizures (malignant hypertension, infection, dialysis disequilibrium, cerebral infarction) when seizures are present, as the imaging alone may not distinguish between these etiologies.